
Our Reports feature allows you to quickly add your alerts analytics, top articles, and journalists into an interactive, presentation style report.
This article walks you through how to create beautiful reports based on your chosen alerts.Creating Your Report
Reports allow you to accurately measure the impact of your media and easily share it with your boss or client.
To create your first report, navigate to the Reports page and choose "Create New Report".
On that page, you can also see your existing reports, if you have any. Once completed, reports can be printed, exported as a pdf, or shared with the URL.
Each report consists of a cover followed by a series of analytics. You not only have complete control over the aesthetic of your reports, but you can also choose what analytics you want to show and what alerts you want to attach to them.
This powerful tool allows you to choose one, a few, or all of the following analytics to create the perfect report for any situation:
-
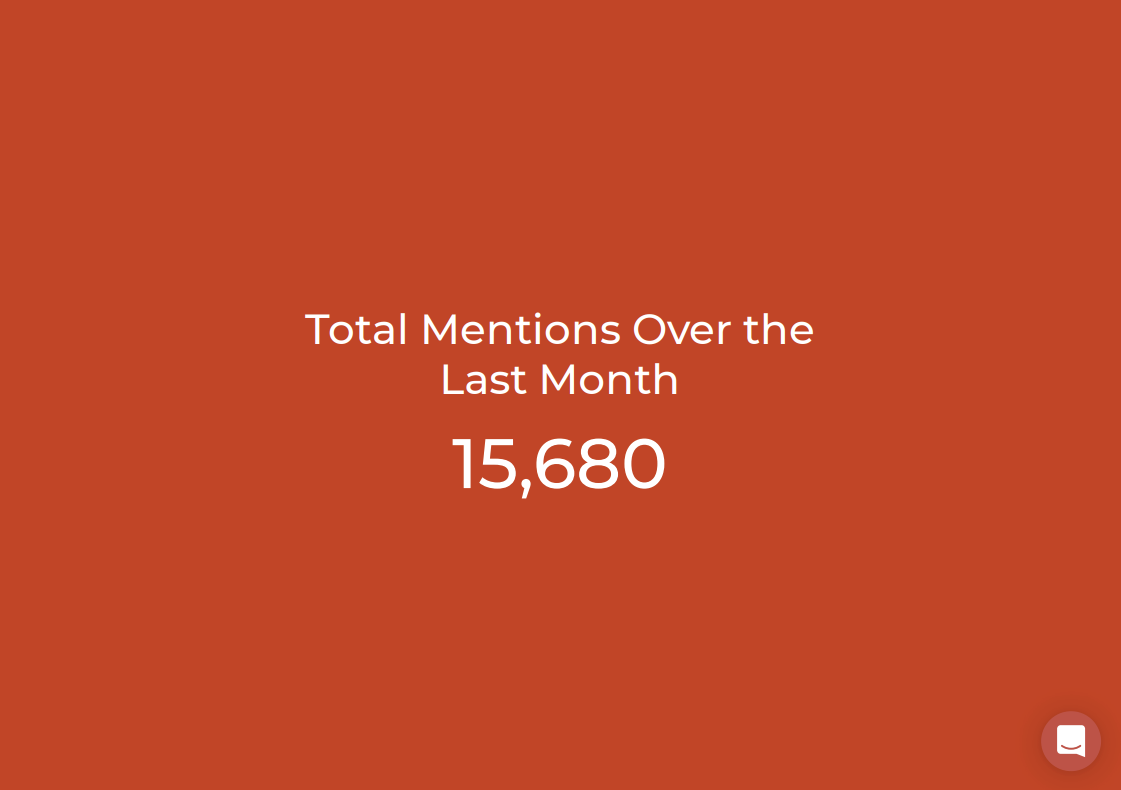
Use the Total Mentions analytic to show the total number of mentions within your given date range.
-
Use the Stories over Time analytic to show the day-by-day breakdown of your alerts over time.
-
Use Top Associations to identify who or what your product is grouped within the media ecosystem.
-
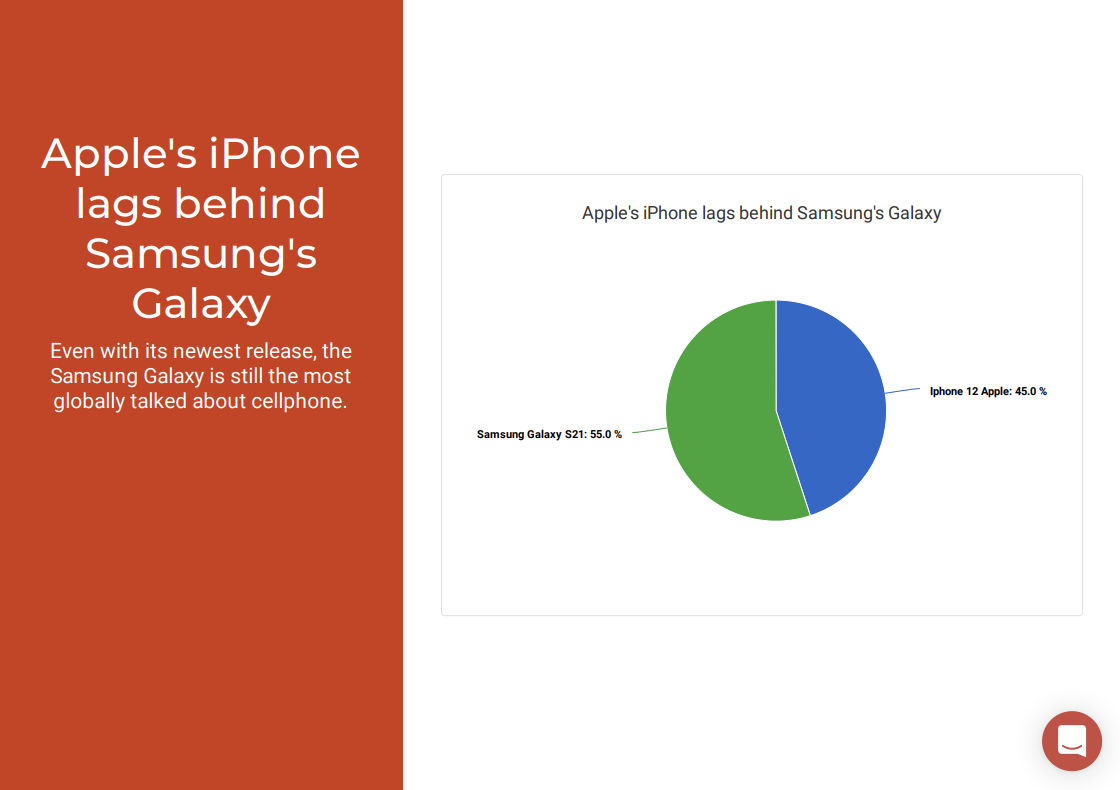
Use the Share of Voice analytics to track and compare the total mentions of your product to that of your competitors in your given date range.
Reports can be continuously updated to reflect the newest information. Just go to the Reports section and click on the desired report. Once you have finished updating, be sure to click Save Report!
Example Report
On the Reports page you can:
- name the report,
- choose the date range, and
- pick the alert you want to report on
For branding purposes, you can also customize your report by choosing your primary color scheme and adding your brand's logo.
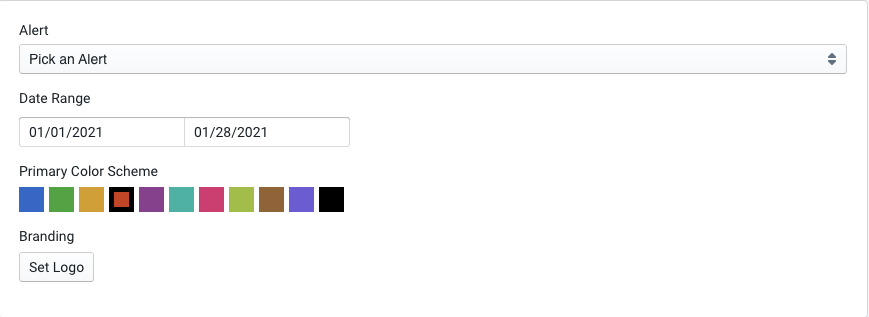
Once you complete this initial section, options for the analytics you can add will display on the right hand side of your screen.
Add Analytics To Your Report
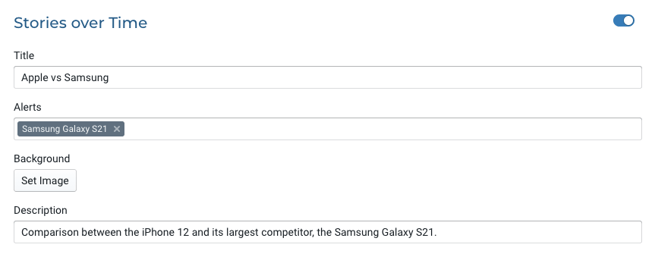
Use the toggle in the upper right-hand corner to include or exclude each analytic from the report:

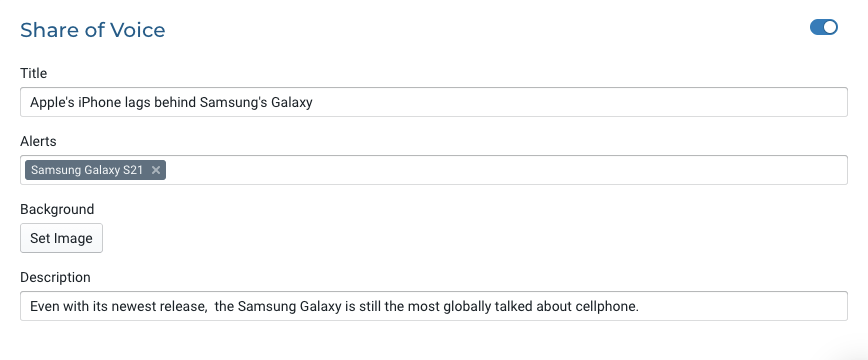
For each individual analytic you can choose a title, description, and background. The Reports feature will then add the data and chosen infographics automatically.
As you work, you can view the report in a new tab by first clicking the "Save Report" and then "View Report" buttons in the upper right-hand side of your screen.
Your final product will look something like this:
Types of Analytics
Total Mentions
Use the Total Mentions analytic to show the total number of mentions within your given date range. This is a great tool to track media presence over time, and can be useful when making a comparison.
Stories over Time
Use the Stories over Time analytic to show the frequency of your reports over time. By adding multiple alerts, this day-by-day breakdown becomes a great tool for tracking your competitors, comparing products, and monitoring your media activity.
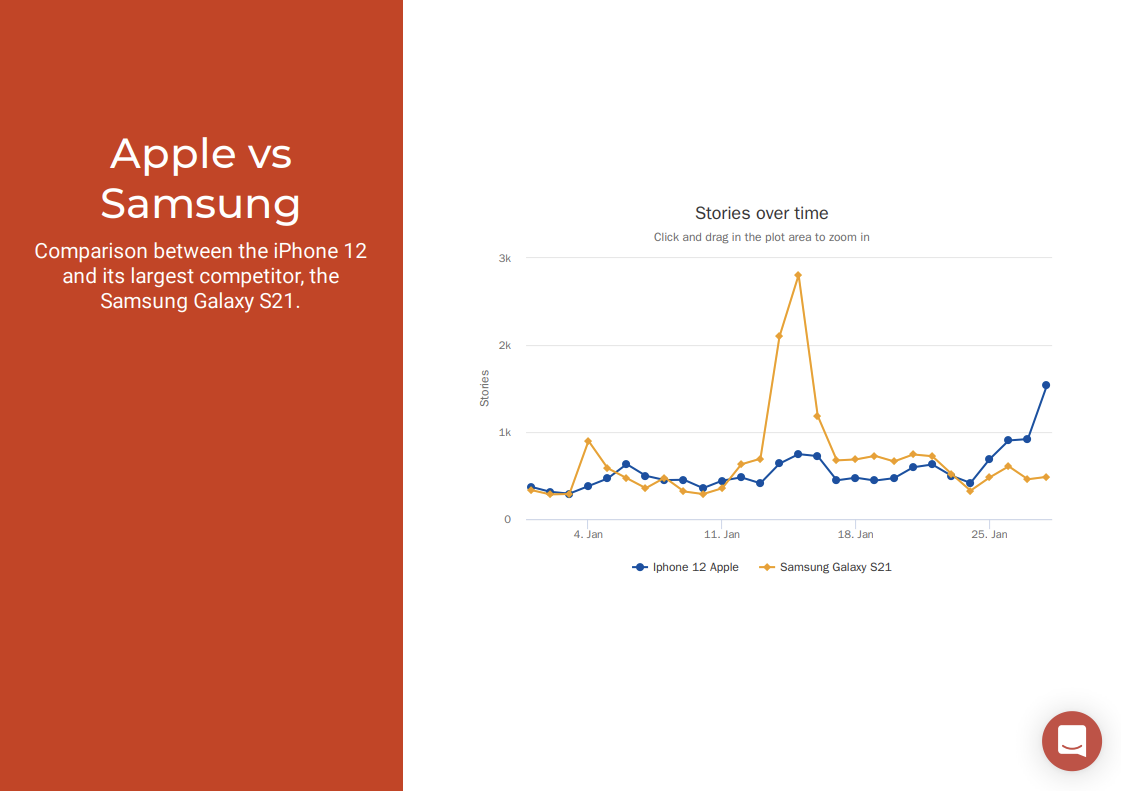
To do this, click the Alerts section of the analytic and type in any alert you previously created. You can add as many alerts as you want, and they will be automatically added to your report.
Top Associations
Use Top Associations to identify who or what your product is grouped with in the media ecosystem. This analytic will identify the brands, influencers, and journalists that are part of the larger conversation surrounding your product.
Share of Voice
Use the Share of Voice analytic to track and compare the total mentions of your product to that of your competitors in your given date range.
Similar to Stories Over Time, you do this by clicking the Alerts section of the analytic and adding as many alerts as you want.
Save the report - and you're done!